I want to group together common metrics/dimensions in my Explores. #1851
Comments
|
@PriPatel quick question about this one. Let's say I have a dimension Does that mean that we have two groups appear in the sidebar:
Basically, what's the behaviour if you have a dimension + metric in the same group? ^I'm going to say that having a metric + dimension allowed to be in the same group is a requirement. The question now is how we actually display this |
|
@TuringLovesDeathMetal Metrics > Group 1 > the metrics or Its a good opportunity to change the way we display these. I guess my only concern now is custom metrics! |
|
@PriPatel I'd almost be tempted to "pull out" the dimensions + metrics that are in your results table to the top of the list of dimensions + metrics. Then you'd have custom metrics right below those fields Then the rest of the fields below there. ^This might be a bit complicated to navigate though 😅 I'd have to play around with it a bit to see |
|
Also maybe having a way to only navigate dimensions or metrics at one time (using tabs or a drop-down filtering option) which is like "show me just metrics", "show me just dimensions" or "show me all fields" |
|
aaaaanyways - the sidebar is an ever-evolving thing haha |
|
😅 agreed ! |
|
An experiment: I thought that if youre picking filters from a dropdown, whats wrong with picking the fields from a dropdown in the first place? |
|
ooh interesting! Personally, I like to see a list of all of the fields (in the same way that filters give you auto-suggestion for the available fields). Mostly because a drop-down list of all of the fields in my table and in the joined table could be a bit overwhelming... With filters, i'll normally go from the sidebar or from a table value to select a filter (I rarely manually type it in) maybe something worth prototyping + talking to users about 👀 |
|
Had another request from a user on a call yesterday around them wanting to be able to group common metrics together in the explore view. Their idea was that they should be able to group the ones they want together and scan through that way. |
|
Is there anything wrong right now with visually grouping these the same way we group the date/time dimensions? I suspect that'll be the easiest way initially to group them in the sidebar! |
|
I'd agree with visually grouping selected items at the top. |
|
@hamzahc1 yes, as long as we don't let people mix metrics/dimensions together into groups. Otherwise, we need to try to think about how we communicate whcih fields are metrics vs. dimensions within the groups. Does that make sense? |
|
This issue has been linked to a Canny post: I want to group together common metrics/dimensions in my Explores. 🎉 |
|
@TuringLovesDeathMetal I'll update the description of this ticket and remove the design tag from this. |
|
🎉 This issue has been resolved in version 0.181.0 🎉 The release is available on:
Your semantic-release bot 📦🚀 |
Description: What is it?
I want to be able to add
dimension_groupsormetric_groupsto my Explores.These groups would appear in Lightdash in my Explore and override the default flat-list of dimensions and metrics in the sidebar.
e.g. user_name, user_country, user_age, user_gender are all grouped together in a drop down group called user demographics
Problem: What problem does this solve?
It's hard to navigate through all of the metrics + dimensions in an Explore and know which are related to each other (or even relevant!)
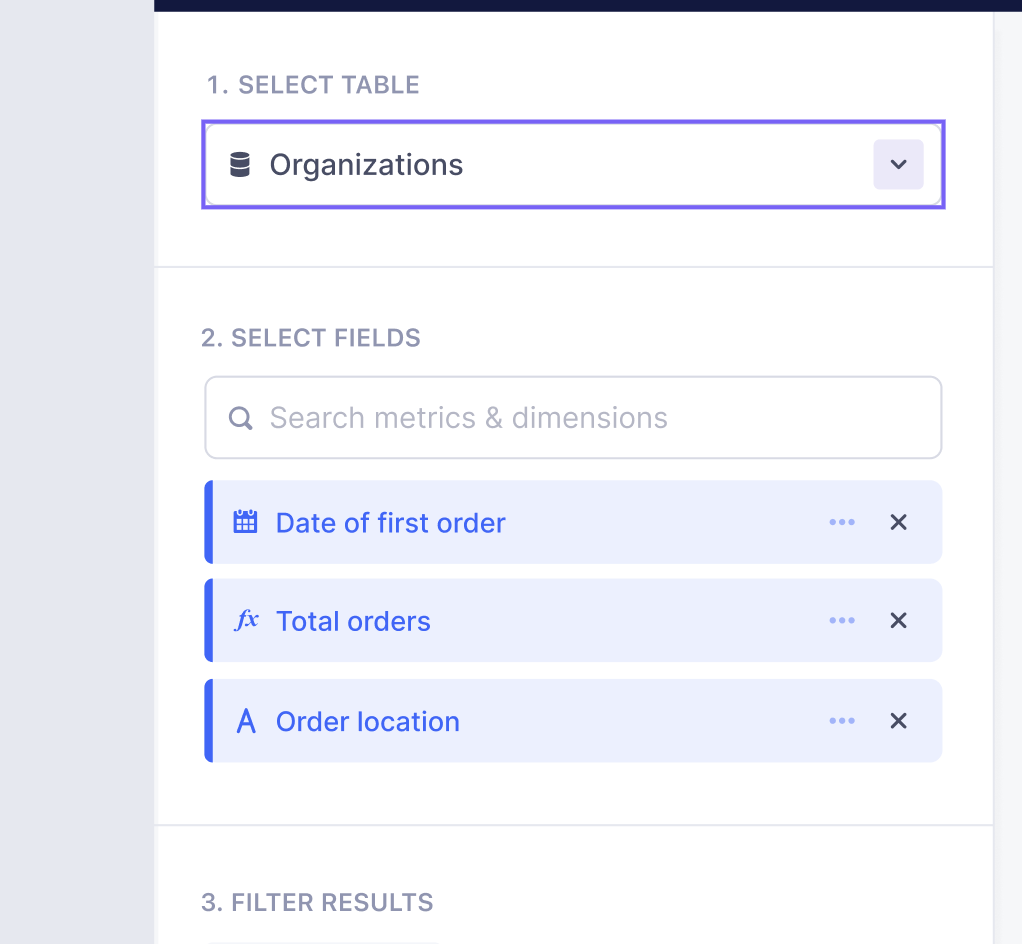
What: Roughly, what does this look like in the product?
In your YAML, you'd write:
Wireframe here:
https://www.figma.com/proto/Mhuwki1Bj1akQIwPyr1gWw/Lightdash-product?node-id=5533%3A89295&scaling=min-zoom&page-id=5438%3A86217&starting-point-node-id=5533%3A89295&show-proto-sidebar=1
Hi-fidelity designs coming soon, but first step is to add the groups in, similar to how we deal with date and time groups.
The text was updated successfully, but these errors were encountered: